 When posting content on your site—whether that content is in the form of articles, reviews or blogs—you need to know what content is commonly “Liked” or shared and on which social networks. In this way, you can create more of the popular content and remove/tweak the content that isn’t winning over your users.
Looking to improve your content? Here are some tips.
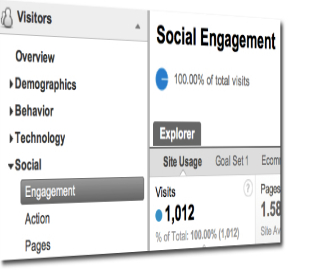
Google Analytics has developed Social Engagement reports that allow you to see how people are sharing content from your site. Here’s a look at the three types of reports and how they work.
Social Engagement
Social Engagement reports compare the number of pages viewed per visit, average time spent on your site, bounce rate, and other metrics for visits that include—and do not include—social actions. For each page visited that includes a social action, you can compare metrics for each source/action combination; i.e. you can compare whether visits that included a +1 button click spent longer on your site than visits that included a Facebook Send.
Check out some great ways to market your business using social media.
Social Action
Social Action reports compare the number of social actions for each social source/action combination. You can compare a Facebook “Like” with a Facebook Send on your site, or compare the total number of FB actions to the number of Twitter actions. This can help you determine what social buttons are most used on your site.
Here are some tips on how to create a successful Twitter account.
Social Pages
Social Pages reports allow you to see which pages on your site have had social interactions altogether. This will help you to see what pages on your site produce the most social interactions—be it “Likes,” tweets, or +1’s—and which content is being shared the most and through what social network(s).
Do you use Google Analytics to track your social media? How else do you track your social networking activity? Tell us in the comments below.